
Using a Passive Oscilloscope Probe with a Spectrum Analyser
Solution: Spectrum Analysers are typically used to measure radio frequency (RF) signals. The signals are usually delivered to the RF input of the analyser with an antenna, magnetic probe, or using a cable with a matched impedance. This minimises impedance mismatching which lowers reflected power and provides the cleanest measurement. This is not always an acceptable connection scheme. Especially in circuits that are highly susceptible to loading when attached to low impedance inputs, like those on most Spectrum Analysers.
This application note covers using a passive probe, typically used with an oscilloscope, with a spectrum analyser. We highlight some of the advantages and trade-offs with this technique as well.
Most analysers feature a 50 Ohm input impedance. In fact, many oscilloscopes with analogue bandwidths above a few hundred MHz also feature a 50 Ohm impedance setting. This lower impedance enables better performance at higher frequencies but can significantly load a circuit with higher impedance.
In this application note, we will use an RF signal source to deliver a -10dBm signal at 1GHz (CW Sine Wave) to a spectrum analyser, using a passive 1.5GHz oscilloscope probe.
Here is a screen capture of the signal directly connected to the input of the spectrum analyser using coaxial cable and BNC adapters:
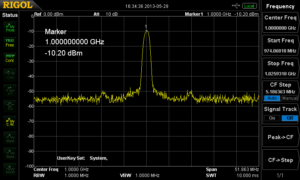
Note that the marker above shows the peak at 1GHz with an amplitude of -10dBm. Now, we connect a 1.5GHz Passive Probe (Rigol RP6150 Passive probe) to the input of the spectrum analyser. The RP6150 is designed to be a 10:1 probe when connected to 50 ohms.
Using a probe with an impedance greater than 50 ohms acts as a voltage divider for signals being delivered to the spectrum analyser. This decreases the voltage to the input and effectively acts as an attenuator. It also has the advantage of lessening the circuit loading that can be caused by connecting the 50 ohm spectrum analyser input directly to the circuit.
Here is the same signal but instead of a direct connection to the RF input, we are using an RP6150 probe to detect the signal.
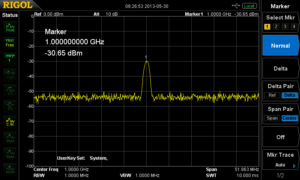
Note that the marker now shows -30dBm for the amplitude. This is due to the probe attenuation factor.
Let’s take a closer look at that probe. Recall that power is the square of the amplitude. Therefore, you can calculate the probe power ratio by simply squaring the probe attenuation factor.
Some common probe attenuation ratios can be found using Table 1.
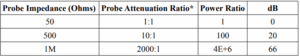
Table 1: Probe Impedance to dB
*With 50 Ohm Input to Spectrum Analyser
Now, we can easily calculate the expected measured power using the equation below: Measured Power (dBm) = Signal Source Power (dBm) – Probe Attenuation ratio (dB)
So, if our Signal Source Power is -10dBm, and the probe attenuation ratio for our RP6150 Passive Probe is 20dB, we would expect to read -30dB on the spectrum analyser as we see in the above screen capture.
For convenience, we can then use the spectrum analysers internal reference setting to adjust for the attenuation of the probe.
Simply press AMPT and set the Ref Level to the probe attenuation ratio in dB. This is a scalar factor that will remove the additional attenuation from the displayed value and give the corrected power value.

Products Mentioned In This Article:
- RP6150 please see HERE