
Transmitter Functionality – A Perfect Education Training with DSA800 and TX1000 Board
In RF world one of the most interesting techniques is, how to transmit RF data and how does it work? Especially for education market RIGOL Technologies offers a perfect learning tool with spectrum analyser [SA] of DSA800 class1 or using RSA3015N2 [RSA] in combination with a TX1000 demo board. A professor or a teacher will have an easy possibility to demonstrate and show the complex chain of a transmitter or receiver part. A student can follow this lesson and understand transmitter functionality with own hands- on at component level. The overall understanding of RF receivers and transmitters can be learned on a simple way.
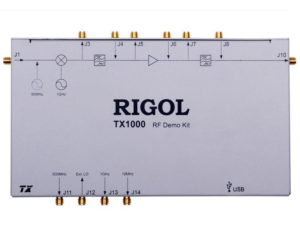
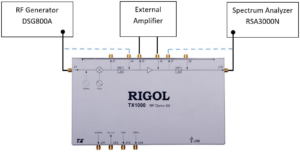
This demo board (see figure 1) has the possibility to modulate an RF carrier (500 MHz or 1 GHz) with a base band signal (up to 50 MHz, max bandwidth: +/- 10 MHz). With spectrum analyser DSA815-TG (up to 1.5 GHz) it is possible to stimulate the demo device (via tracking generator) and to analyse it. Alternatively, an external RF Generator with IQ modulation can be used (like RIGOL DSG821A) to test the device with a modulated baseband signal.
1 DSA815-TG: 9 kHz to 1.5 GHz; DSA832E-TG: 9 kHz to 3.2 GHz; DSA875-TG: 9 kHz to 7.5 GHz. All analysers are available with/without tracking generator.
2 RSA3015N contents sweep based and real time spectrum analyser + vector network analyser and EMI pre- compliance measurement tool with frequency range of 9 kHz to 1.5 GHz (or 3 / 4.5 GHz)
The TX1000 demo board incorporates different components:
• 1 GHz local oscillator
• 10 MHz reference
• Mixer
• 1st band pass after mixer
• Amplifier
• 2nd band pass filter after amplifier
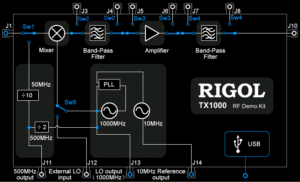
Various switches and connection points are integrated on the board. The demo board has the possibility to measure each internal single component or several in different combinations. For example, it is possible to measure the mixed signal after the mixer or to test the amplifier as a stand-alone device. Furthermore, it is possible to omit a component such as a second bandpass filter and use a self- developed one for comparison tests. A block diagram is shown in figure 2.
The spectrum analyser series DSA800 provides a built-in control window for the demo board TX1000. All switches can be opened / closed very easily with the spectrum analyser after connecting the demo board to the analyser via USB without the need for an additional PC with software. If only the demo board is the component of interest or the RSA3000N series Real-time Spectrum Analyser (with VNA) is used together with this board, RIGOL also provides free software for this demo board for control via PC.
The first test scenario is the measurement of a signal after each component of the complete chain of the transmission path with the internal 1 GHz fixed local oscillator signal. For the next 4 measurements, an input signal (baseband) is used at port J1. A baseband signal with a frequency range of 50 MHz +/-10 MHz can be used at this port. In the next measurement examples, a constant wave [CW] of 40 MHz and – 10 dBm was used as the baseband input. If the teacher does not have an RF generator available to generate a baseband signal, the tracking generator of the spectrum analyser can also be used as an input (a fast frequency sweep of a DSG3000 can also be used with a start frequency of 30 MHz and a stop frequency of 70 MHz). Each output of the transmission chain can be measured with a DSA800 or RSA3000N series Spectrum Analyzer [SA]. VBW has been reduced in the SA to a lower value than RBW in order to obtain a less noisy trace and also to see small peaks in the test results.
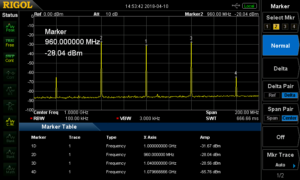
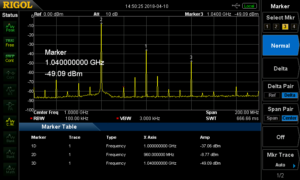
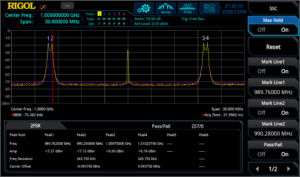
This signal was measured after the mixer process (Figure 1, J3). The measurement in Figure 3 shows the carrier frequency of 1 GHz (marker 1), the wanted signal at 960 MHz (fc – fcw) and the unwanted mirror frequency of 1.04 GHz (fc + fcw). In addition, some unwanted frequency components (920 MHz, 1.08 GHz) are visible. They can all be measured with the spectrum analyser with advanced marker functions.
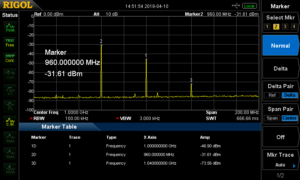
After the first filter (Figure 1, J5), next to the mixer, the mirror frequency is 45 dB lower than in the previous measurement without filter (Figure 4). The carrier at 1 GHz is about 15 dB lower than before. The wanted signal at 960 MHz is also lower by about 3.6 dB because the filter has a max. insertion loss of 4 dB. Both unwanted components are more suppressed than before.
The next additional component after mixer and filter is an amplifier. This component amplifies the main wanted signal with approx. +20 dB. But also the carrier and the unwanted signal components are amplified (Figure 5), as well as the unwanted mirror frequency due to linearity effects of the amplifier.
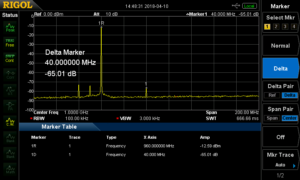
The last component in the transmission chain is a second bandpass filter. This filter suppresses the carrier, the mirror frequency and the unwanted signal components (Figure 6). Most of them are no longer visible at this dynamic setting of the device. The carrier is 65 dB lower than the modulated baseband at 960 MHz.
The next step is to analyse each component as an individual component. The first analysis focuses on the mixer. With the integrated mixer, it is possible to measure the 1 dB compression point, conversion loss and isolation.
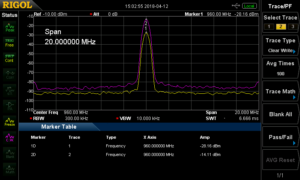
For the 1-dB compression point, the same CW sine signal of 40 MHz with a starting power of -10 dBm at the IF input (connector J1) is used. This signal can be generated using RIGOL’s DSG800(A) series or DSG3000B series RF generator. The spectrum analyser is connected to the RF output (J3) of the mixer. The input signal is now increased in 1 dB steps. A linear increase of the mixer signal is expected. If the RF output cannot follow the IF input linearity and deviates by 1 dB, a 1-dB compression point is detected. With the DSA800 or RSA3000N series, different waveforms can be used for this test.
The first yellow trace shows a mixed signal at -28 dBm with an IF input of -10 dBm, resulting in a conversion loss of 18 dB. This trace can be frozen in the spectrum analyser. A second pink trace uses the trace type “clear write”. Now the IF input signal can be increased in 1-dB steps until the mixer output linearity deviates by 1 dB, resulting in a conversion loss of 19 dB. (Figure 7). The 1 dB compression point of the TX1000 mixer is visible at an IF input power of +5 dBm.
The last tests focused on the entire transmission chain of the TX1000 using a CW signal as intermediate frequency. The next measurements will use a 2FSK baseband signal instead of a CW signal. The focus is on the measurement point after the mixer process to a carrier.
Figure 8 shows an example with a 2FSK signal at the mixer output. The 2FSK baseband is at the IF input with a carrier of 10 MHz, resulting in a distance of 10 MHz from the 1 GHz carrier. This 2FSK figure can be analysed with the real-time mode of the RSA3000N with density/spectrogram. The characteristics of the 2FSK modulation are visible in the lower (wanted) and upper (unwanted) mirror baseband.
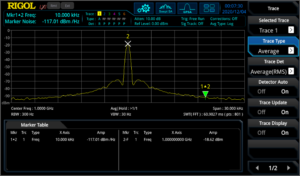
The same signal is tested again in the real-time mode of the RSA3000N (Figure 9) using the “Seamless Signal Capturing” function. With this measurement it is possible to measure the frequency deviation and the distance to the carrier of 2FSK signal(s). In addition, the frequency deviation and amplitude level of the 2FSK signal is measured. Furthermore, a pass/fail test of the amplitude tolerances can be performed with this measurement.
Until now, the internal local oscillator of the TX1000 has been used. However, it is also possible to use a self-generated external LO carrier signal using an RF generator such as DSG821(A) (Figure 1, J12) between 50 MHz and 1000 MHz. The oscillator driver power of the TX1000 is +7 dBm, which can be easily adjusted in the DSG800(A).
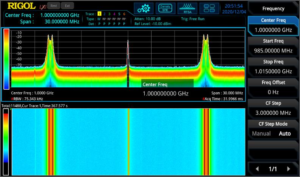
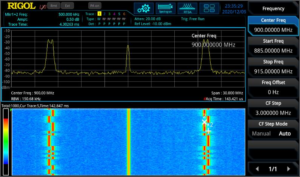
Figure 10 shows the same signal as in Figure 9, but with external LO carrier of 900 MHz instead of the internal LO. By using the spectrogram in combination with the normal trace, the acquisition speed can be reduced to 100 µsec. It is now possible to measure the details of different data blocks within the spectrogram using delta and Z markers. The difference in frequency, time and amplitude can be analysed in this way.
In the next measurement, the focus goes back to the internal LO of the TX1000, where the phase noise can be analysed with the spectrum analyser. The phase noise measurement measures the statistical short-time oscillation around the center frequency. Phase noise can have a significant impact on the quality of the transmitted signal by magnifying spectral lines adjacent to the main carrier that may overlay smaller (wanted) baseband components. Larger baseband components have a worse signal-to- noise ratio. To minimise the negative influence with digitally modulated signals, an LO with low phase noise should be used. The short-term stabilisation of the frequency with an LO depends on the oscillator used. For voltage-controlled oscillators [VCO], a PLL circuit is used to improve their stability.
With the RSA3000N and DSA800 series, it is possible to use a noise marker with the reference to 1 Hz bandwidth. This noise marker can be used to qualify the distance to the carrier [dBc] in amplitude with a frequency offset of, for example, 10 kHz. In the measurement (Figure 11) the typical characteristic of PLL stabilization (two elevations next to the carrier) can be seen on the trace. The measurement of the phase noise of the internal local oscillator of the TX1000 is better than -98 dBc/Hz at 10 kHz frequency offset:
The next part of interest in the TX1000 is the amplifier. Following the same principle as for the mixer (measured in Figure 7), the 1 dB compression point can be analysed to qualify the linear operating range of the amplifier. For the transmission of digitally modulated signals, it is important to have a good and wide linear amplifier range, since digital signals have a high peak-to-average ratio (the amplitude deviation can be very small, but also larger). All these signal components must be amplified in a linear range to avoid negative issues in modulation quality during transmission. With the TX1000 it is possible to disconnect the internal amplifier (J5 / J6 open) and to integrate a self-developed external amplifier into the transmission chain of the TX1000. Comparison tests of different amplifiers can be performed, helping students to design and optimise their own amplifiers (Figure 12).
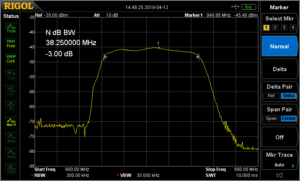
The next measurement will focus on the second bandpass filter. This filter can be measured with the DSA815-TG using the tracking generator at the input. The test cables used can be connected together and normalisation can be performed to avoid their influence on the test result. A 3 dB marker can be used to measure the filter bandwidth at half amplitude of the filter (Figure 13). This S21 characteristic is a scalar measurement, since a spectrum analyser with superposition techniques does not contain phase information.
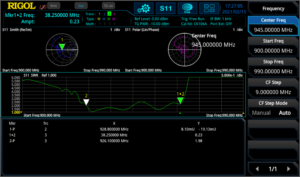
The RSA3000N has a vector network analyser mode. With this mode, S11, S21 or Distance-to-Fault measurements can be performed, since phase information is available in addition to amplitude information. With these functionalities, additional measurements are possible (such as phase over frequency range or with S11, Smith Chart/Polar Chart and accurate VSWR analysis). With the RSA3000N, the S11 back reflection characteristic was measured with the same filter (Figure 14).
The TX1000 in combination with a spectrum analyser such as the DSA815-TG or the RSA3015N is an ideal tool in educational areas such as universities and technical schools to easily demonstrate the complexity of a transmitter’s functionality. Not only can the analysers be used to create a hands-on lab for students, but due to their extreme flexibility, the instruments can be used for many other engineering applications and further R&D measurements. RIGOL also offers an RX1000 board that can be used with the DSG800(A) series RF generator to perform the measurement procedures in the reverse direction to demonstrate a receiver’s functionality. RIGOL offers one of the best price/performance ratios with outstanding RIGOL quality, which is a result of our more than 20 years of test and measurement experience.
Products Mentioned In This Article: