EMI/EMC Pre-Compliance Bundles for RIGOL Spectrum Analysers – Limited Time Only!
Posted on: August 27th, 2025 by Kane Brady
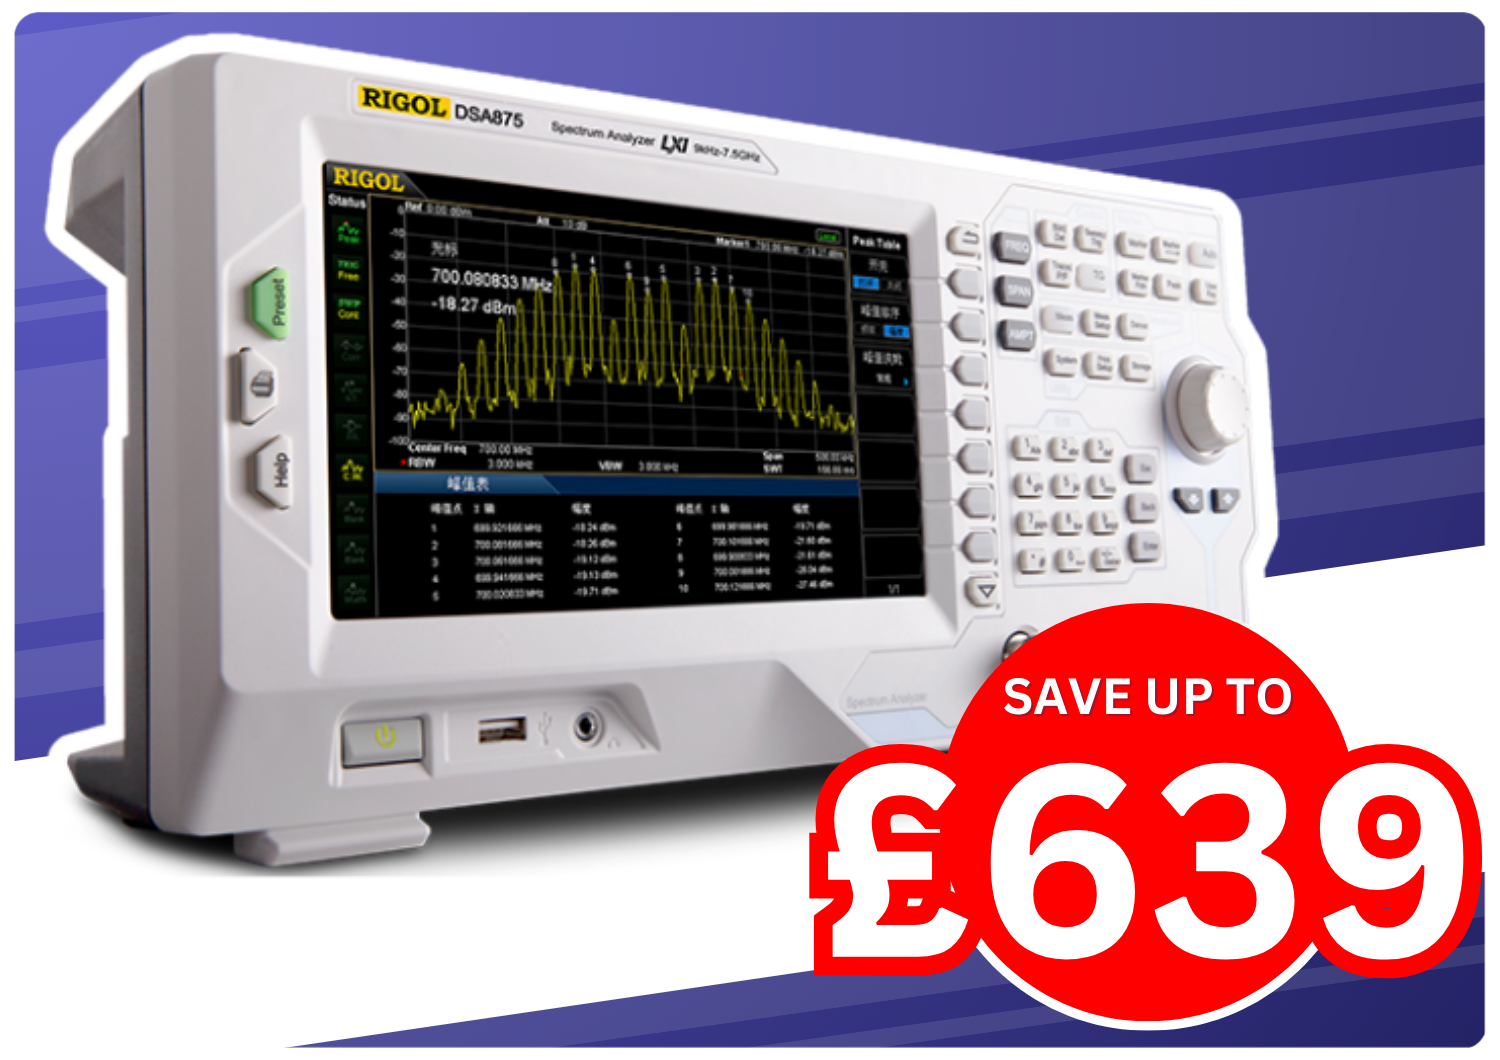
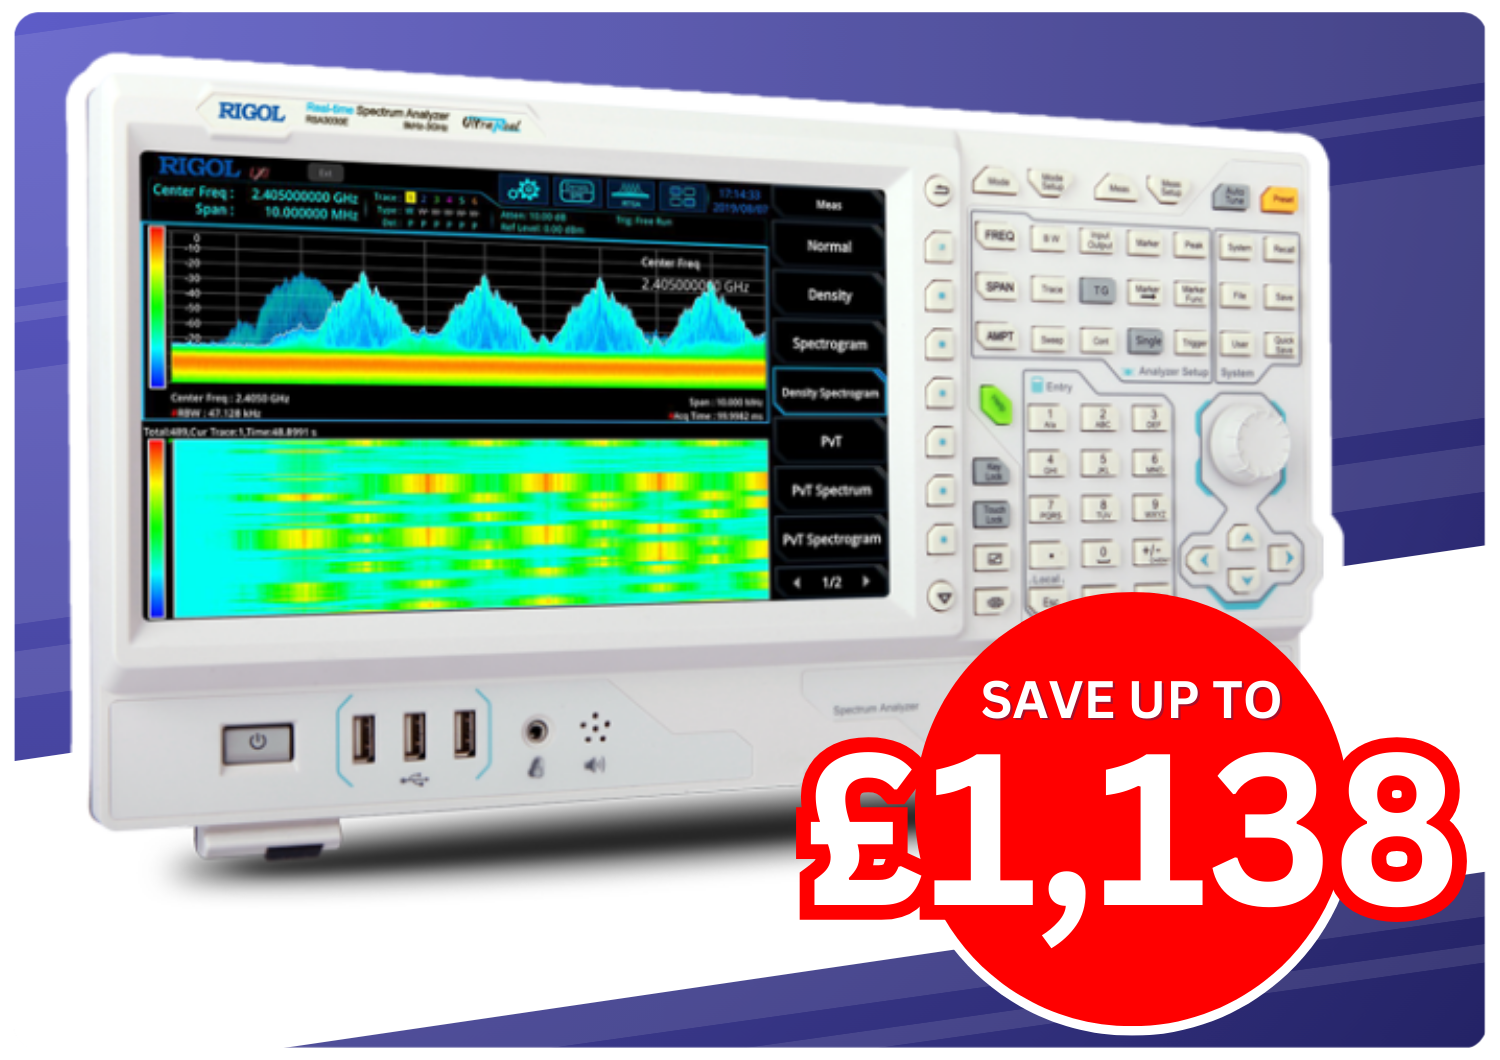
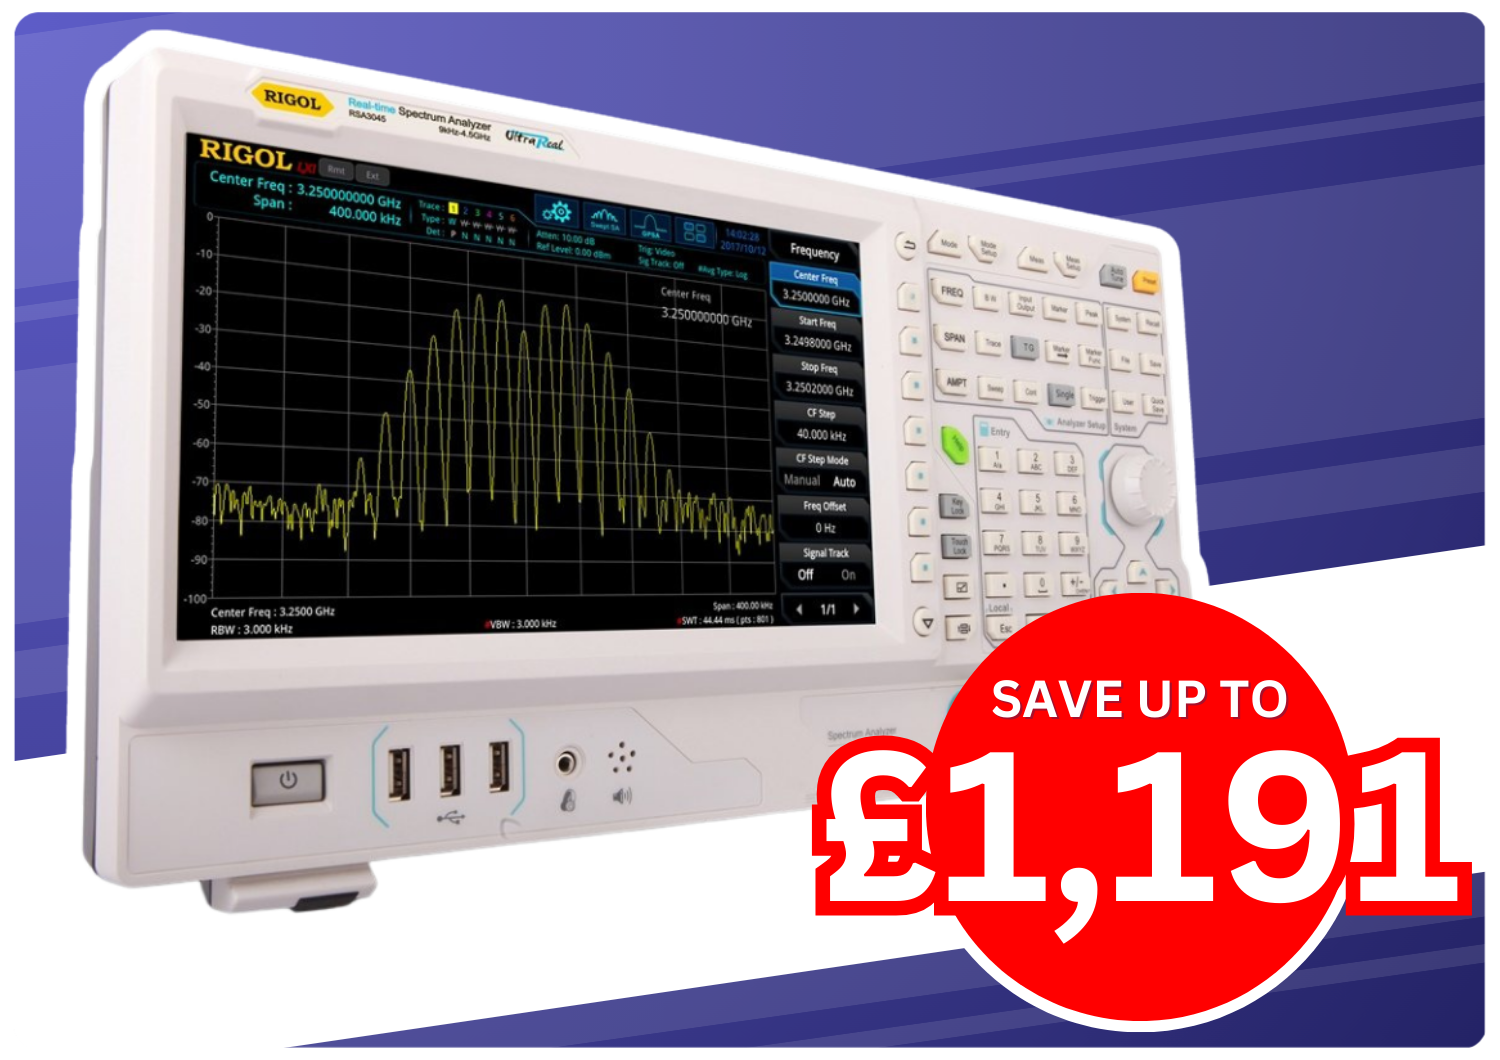
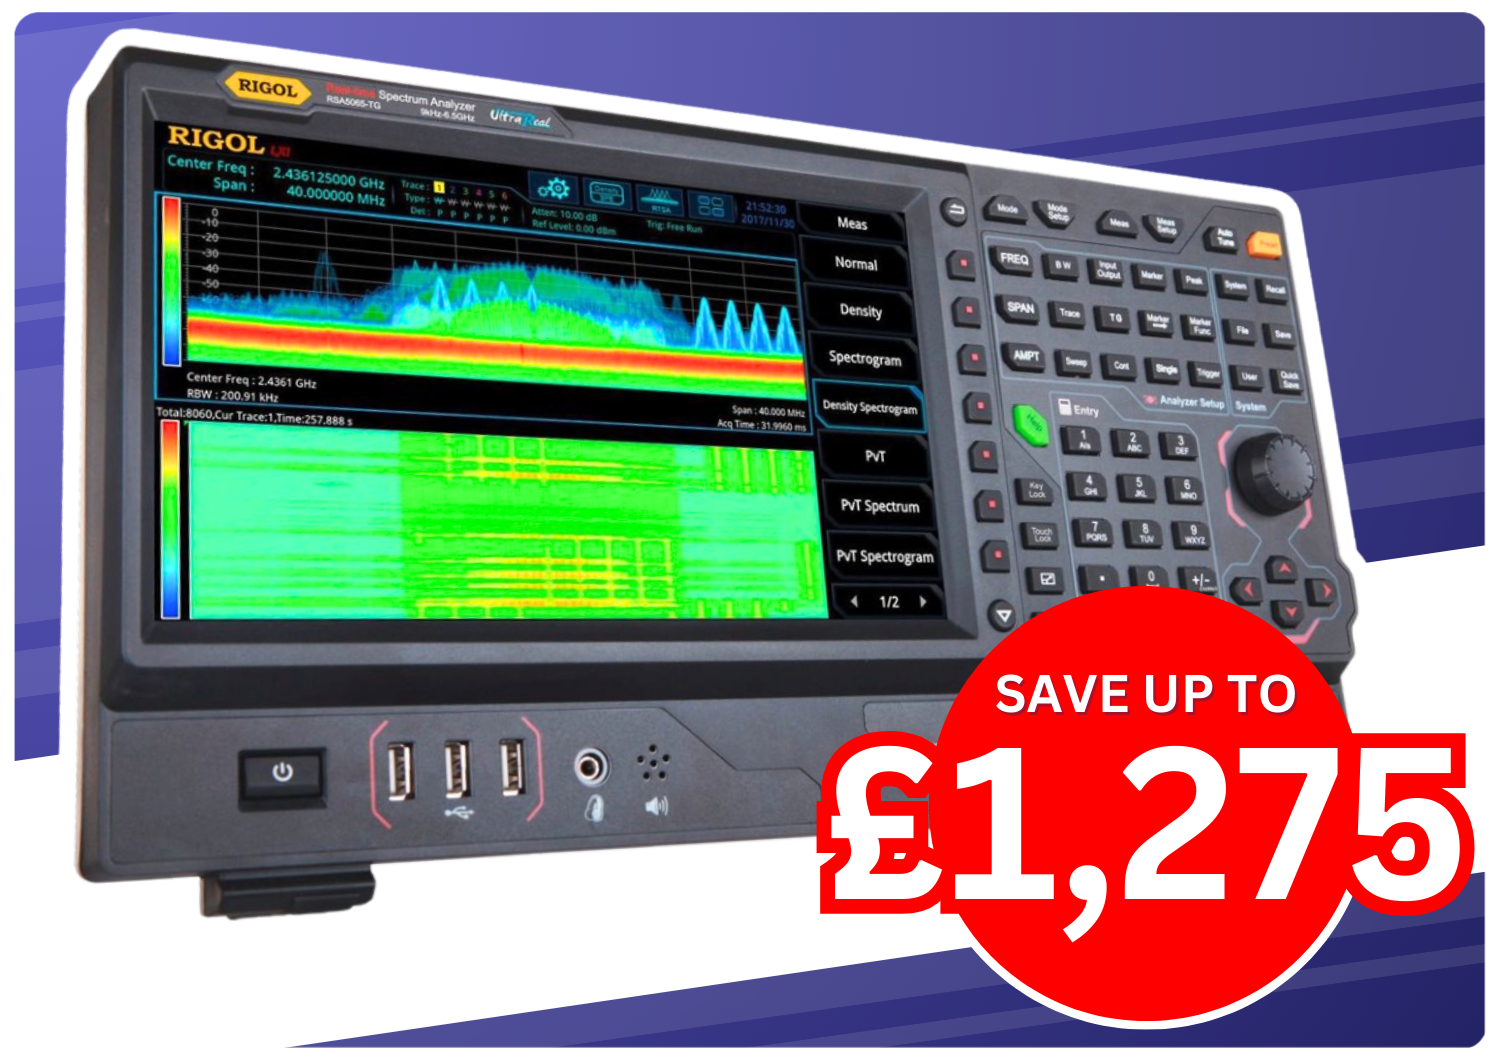
Enhance your EMI pre-compliance or diagnostic setup with discounted bundles that include EMI options, preamplifiers, Tekbox near-field probes, and EMCview software — all at a fraction of the list price.
Each bundle includes
EMI Software Option for the Product
PA Software Option for the Product (excluding the DSA800 Series)
Select your desired Rigol spectrum analyser on the product page. Use the “Select Bundle” dropdown to choose Bundle 1–4, then add to cart and checkout online.
This website uses cookies to improve your experience. You can change your preferences at anytime from our Privacy Policy page. Cookie SettingsAccept
Privacy & Cookies Policy
Privacy Overview
This website uses cookies to improve your experience while you navigate through the website. Out of these, the cookies that are categorized as necessary are stored on your browser as they are essential for the working of basic functionalities of the website. We also use third-party cookies that help us analyze and understand how you use this website. These cookies will be stored in your browser only with your consent. You also have the option to opt-out of these cookies. But opting out of some of these cookies may affect your browsing experience.
Necessary cookies are absolutely essential for the website to function properly. This category only includes cookies that ensures basic functionalities and security features of the website. These cookies do not store any personal information.
Any cookies that may not be particularly necessary for the website to function and is used specifically to collect user personal data via analytics, ads, other embedded contents are termed as non-necessary cookies. It is mandatory to procure user consent prior to running these cookies on your website.